EU Sheets · Feature spotlight
The essentials at a glance.
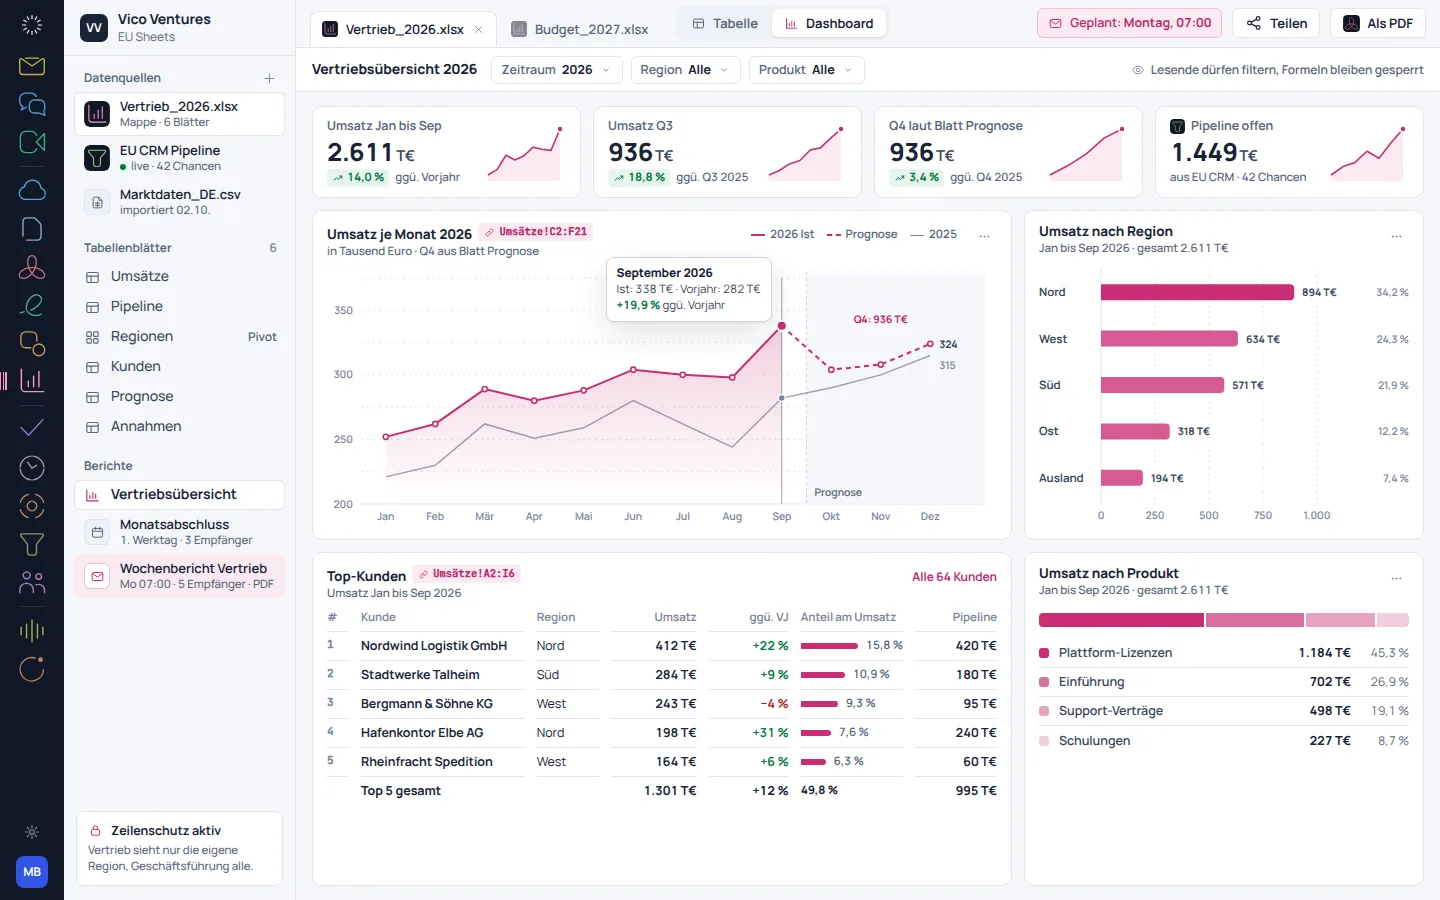
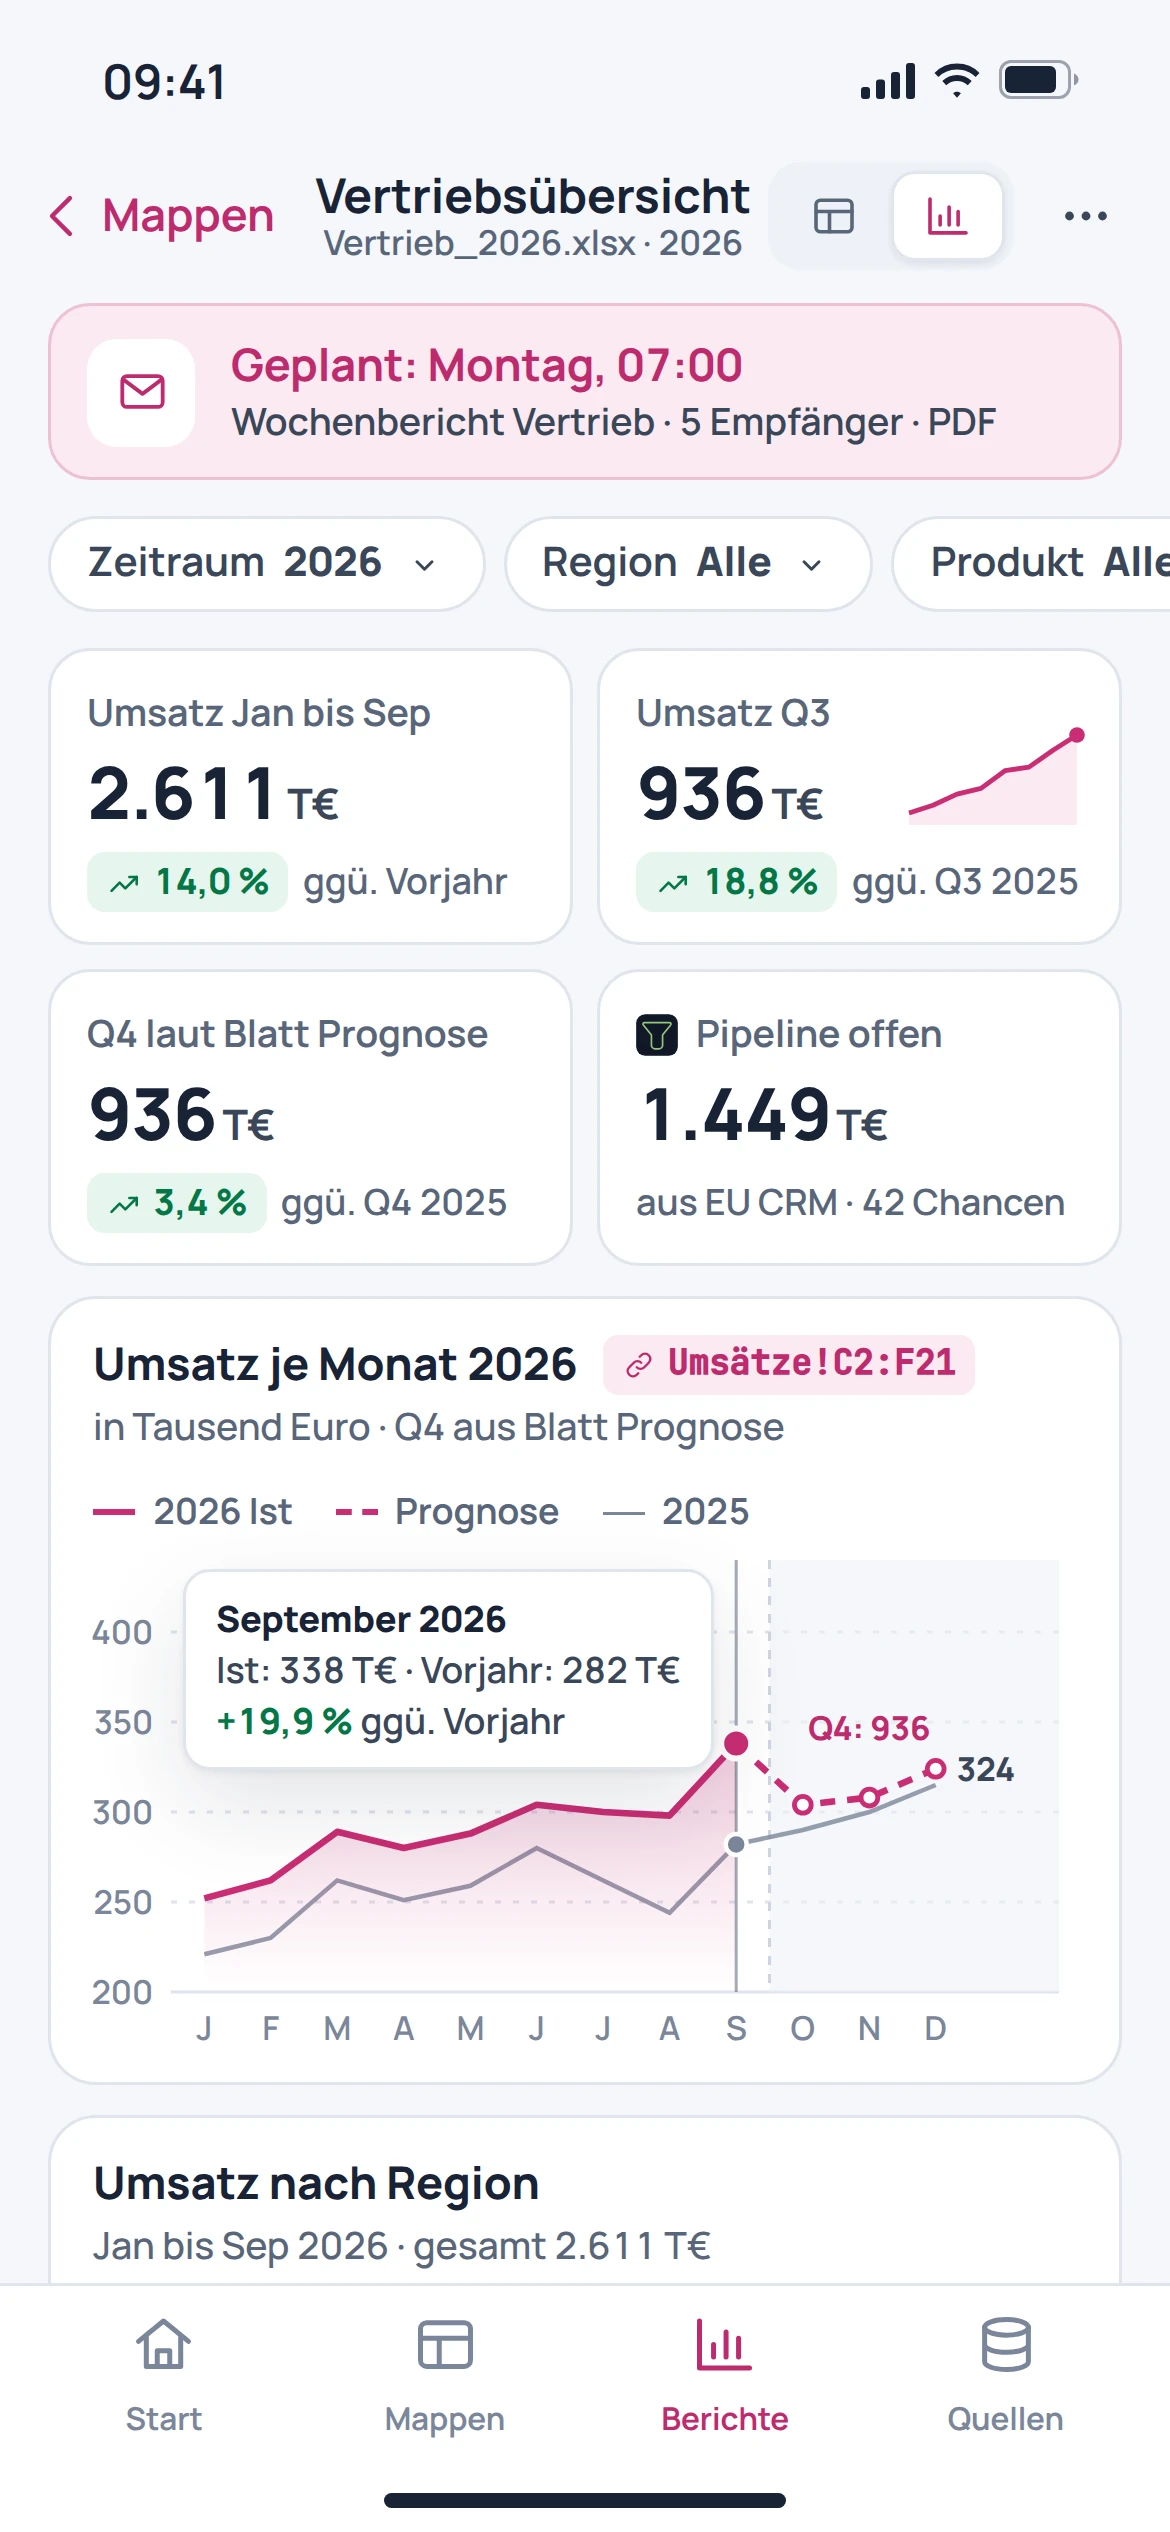
A dashboard brings together metrics, charts and tables. This makes it possible to discuss a result from several perspectives without losing sight of the underlying figures.
The workflow
What matters.
- Compile key figures
- Review changes compared with the previous period
- Show charts and tables together
Keep working with EU Sheets